eBPF: Turn anything into metrics

Intro
Recently, I’ve been working on my personal project, k8s-matahari. It started as a way to run games on Kubernetes: I store all of my games on a PVC and use NFS as the StorageClass.
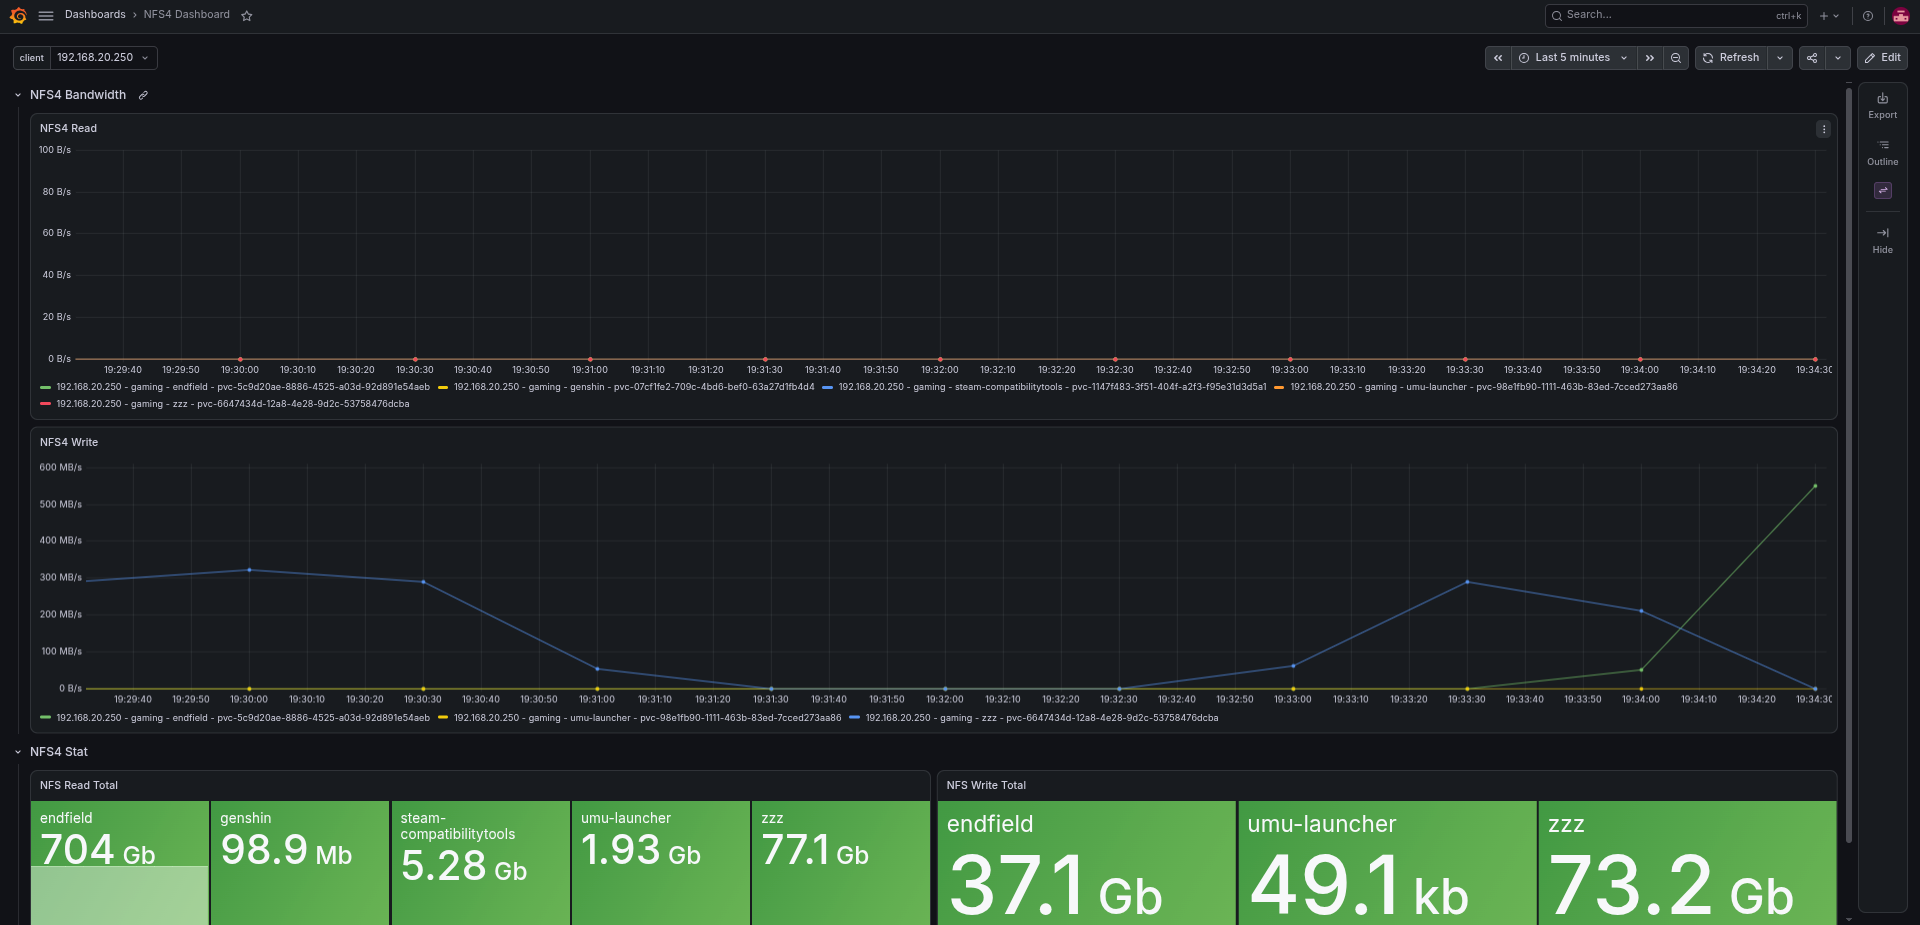
The issue that bothered me was that I couldn’t monitor PVC bandwidth on the NFS server. The NFS server does expose statistics, but they’re server-wide, not specific to a directory or PVC from the Kubernetes perspective.
1
2
3
4
5
6
7
8
9
10
11
12
13
14
15
16
17
18
19
20
21
22
23
24
25
26
27
28
29
30
31
32
33
34
35
36
37
38
39
40
root@storage-humanz:/home/humanz# nfsstat -s -4
Server rpc stats:
calls      badcalls   badfmt     badauth    badclnt
79285405   115        115        0          0

Server nfs v4:
null             compound
355       0%     79265016 99%

Server nfs v4 operations:
op0-unused       op1-unused       op2-future       access           close
0         0%     0         0%     0         0%     3327008   1%     1474551   0%
commit           create           delegpurge       delegreturn      getattr
211704    0%     484015    0%     0         0%     1036307   0%     32099696 13%
getfh            link             lock             lockt            locku
2485541   1%     216905    0%     90        0%     0         0%     83        0%
lookup           lookup_root      nverify          open             openattr
3065229   1%     0         0%     0         0%     1788960   0%     0         0%
open_conf        open_dgrd        putfh            putpubfh         putrootfh
0         0%     98        0%     79866961 34%     0         0%     875       0%
read             readdir          readlink         remove           rename
16523719  7%     593487    0%     71342     0%     1481972   0%     459794    0%
renew            restorefh        savefh           secinfo          setattr
0         0%     216905    0%     677583    0%     0         0%     598320    0%
setcltid         setcltidconf     verify           write            rellockowner
0         0%     0         0%     0         0%     5342885   2%     0         0%
bc_ctl           bind_conn        exchange_id      create_ses       destroy_ses
0         0%     15        0%     227       0%     160       0%     103       0%
free_stateid     getdirdeleg      getdevinfo       getdevlist       layoutcommit
83        0%     99        0%     0         0%     0         0%     0         0%
layoutget        layoutreturn     secinfononam     sequence         set_ssv
0         0%     0         0%     422       0%     79264424 34%     0         0%
test_stateid     want_deleg       destroy_clid     reclaim_comp     allocate
0         0%     0         0%     72        0%     129       0%     178       0%
copy             copy_notify      deallocate       ioadvise         layouterror
884       0%     0         0%     0         0%     0         0%     0         0%
layoutstats      offloadcancel    offloadstatus    readplus         seek
0         0%     0         0%     0         0%     0         0%     9         0%
write_same
0         0%
The existing exporters use the same statistics, so I believe there aren’t any NFS exporters that provide client-level stats. However, I remembered a tool for NFS in iovisor/bcc: nfsslower. I thought eBPF might solve my problem, so I started researching.
Research
First, I looked at the source code for nfsslower, but after a few reviews I didn’t find anything interesting. nfsslower mainly reports the PID and application arguments, along with commit latency. That’s different from what I needed: the data size, client IP address, and path.
So instead of tracing the application on the client, i started looking at the NFS server. The server already has to know which client sent the request, which file it is working on, and how much data the client asked to read or write. The question is how to get that information out of the kernel and turn it into something Prometheus can scrape.
That is how nfs4_exporter started. It uses eBPF kprobes to observe the NFS server functions, sends events to a Go program, and exposes the results as Prometheus counters.
Finding the client IP
For NFSv4, the interesting functions are nfsd4_read and nfsd4_write. Both receive a struct svc_rqst * as their first argument. This is the server-side RPC request, and its rq_addr field contains the remote address. That means we can get the client IP from the request itself without trying to associate an NFS server worker PID with a client.
Here is the path from the incoming request to the client label:
flowchart TD
	client["NFS client"] -->|"RPC request"| server["Linux NFS server"]
	server --> read["nfsd4_read"]
	server --> write["nfsd4_write"]
	read --> probe["eBPF kprobe at function entry"]
	write --> probe
	probe --> arg["First argument: svc_rqst *rqstp"]
	arg --> addr["rqstp->rq_addr"]
	addr --> family{"Address family"}
	family -->|"AF_INET"| ipv4["sockaddr_in.sin_addr.s_addr"]
	family -->|"Other"| skip["Skip event"]
	ipv4 --> event["Ring buffer event"]
	event --> go["Go exporter: format client IP"]
	go --> metrics["Prometheus client label"]
The probe reads the function arguments from the registers and passes the request to a shared trace_rw function. Simplified from the BPF program, the important part looks like this:
1
2
3
4
5
6
7
8
9
10
11
12
13
struct svc_rqst *rqstp = (struct svc_rqst *)PT_REGS_PARM1(ctx);

struct __kernel_sockaddr_storage remote = {};
bpf_probe_read_kernel(&remote, sizeof(remote), &rqstp->rq_addr);

u16 family = 0;
bpf_probe_read_kernel(&family, sizeof(family), &remote.ss_family);
if (family != AF_INET)
	return 0;

struct sockaddr_in *sin = (struct sockaddr_in *)&remote;
bpf_probe_read_kernel(&data->addr4, sizeof(data->addr4),
					  &sin->sin_addr.s_addr);
The real code reserves an event from the ring buffer before writing into data. It also captures the source port, although the Go exporter currently uses the IP address, not the port, as the client label. The address is the peer seen by the NFS server, so a proxy or NAT can make it different from the original application address. At the moment the program filters out non-IPv4 requests, including IPv6.
Getting the size and path
The other arguments give us the rest of the information. For both NFSv4 functions, the second argument is the compound state, which contains the current file handle. The third argument contains the operation-specific data:
| Operation | Size field | File information |
|---|---|---|
nfsd4_read | rd_length | current_fh from the compound state |
nfsd4_write | wr_buflen | current_fh from the compound state |
The BPF program reads the file handle’s dentry and export mount, then walks parent dentries and mount points to collect path components. The components are sent from leaf to root; the Go program reverses them and constructs the path label. The walk is bounded to 16 components, with 128 bytes reserved for each component. Missing information or those bounds can make the resulting label incomplete.
By default, the exporter keeps the first two path components from the reconstructed root-to-leaf path. MAX_DEPTH_PATH changes that depth. This is useful for grouping files under a PVC directory without creating a separate Prometheus time series for every file, but you need to choose a depth that actually separates your PVC directories. The path is derived from the server filesystem, not directly from a Kubernetes PVC name; depending on your layout, you might need a separate mapping to identify the PVC.
There is an important detail about the size: these NFSv4 probes run at function entry. rd_length is the requested read length and wr_buflen is the write request buffer length. The exporter adds those values to its byte counters before it knows whether the operation succeeds or how many bytes are actually completed. So the counters are useful for observing requested NFSv4 traffic, but they are not exact accounting of successful transferred bytes, especially for short reads or failed requests. Measuring completed bytes would require tracing the result as well.
From eBPF events to Prometheus
The kernel program puts the operation, size, IPv4 address, NFS version and path components into a BPF ring buffer. The Go program reads each event, formats the address and path, and updates counters with client, path and version labels. It then serves /metrics on port 2112.
flowchart LR
	probe["NFS server kprobes"] --> ring["BPF ring buffer"]
	ring --> exporter["Go exporter"]
	exporter --> endpoint["/metrics :2112"]
	endpoint --> prometheus["Prometheus"]
The main counters are:
| Metric | Meaning for NFSv4 |
|---|---|
nfsd_read_bytes_total | Sum of requested read lengths |
nfsd_write_bytes_total | Sum of write request buffer lengths |
nfsd_read_operations_total | Observed read requests |
nfsd_write_operations_total | Observed write requests |
These are counters, so we can use rate() to see traffic over time. For example, requested write bytes per second by client and path:
sum by (client, path) (rate(nfsd_write_bytes_total{version="4"}[5m]))
And the read request rate by client:
sum by (client) (rate(nfsd_read_operations_total{version="4"}[5m]))
The exporter also attaches NFSv3 read and write entry/return probes, but those follow a different code path. The explanations of sizes and file handles above are specifically for NFSv4.
Running it
The project README has the full build and Docker instructions. The exporter needs to run on the NFS server with the required privileges to load BPF programs and attach kprobes. Once it is running and clients are generating NFS traffic, check the endpoint:
1
curl -s http://localhost:2112/metrics | grep '^nfsd_'
Then configure Prometheus to scrape the server on port 2112. If the endpoint is empty or traffic is missing, check that the probes attached successfully, the client is using IPv4, and the workload is actually reaching this NFS server. Kprobes depend on kernel functions and their layouts, so kernel version and BTF compatibility matter too. Events can also be dropped when the ring buffer is full, and restarting the exporter resets its in-memory counters.
For me, this is a nice example of using eBPF to fill a gap between server-wide statistics and the labels I actually need. It isn’t perfect accounting yet, but now I can see which clients and directories are generating NFS requests and start investigating PVC traffic from there.
PoC
Comments powered by Disqus.